This new series is an attempt to improve my WinDbg skills. The concept is to create faulty applications and troubleshoot the issue using WinDbg pretending that I have no prior knowledge of the code.
I’ll be using my WinDbg guide as I can never remember the commands! I’m hoping than through those challenges I’ll get to improve the guide. Today’s exercise is inspired by the excellent blog post Pinpointing a Static GC Root with SOS. The post only contains a few commands but I must admit that it took me hours to achieve the same result.
The code
The application is available on GitHub. Clone it, I’ll wait.
It is an ASP.NET Core 2.0 project:
- Compile the solution with the
ReleaseConfiguration - Launch the
SampleApiproject, it should start on port5000- Using
Kestrelwill make the next part easier
- Using
Launch Process Explorer. If you don’t have this gem drop everything you’re doing and download it now! Click on the crosshair, mouse hover the process you want to target and release the button:
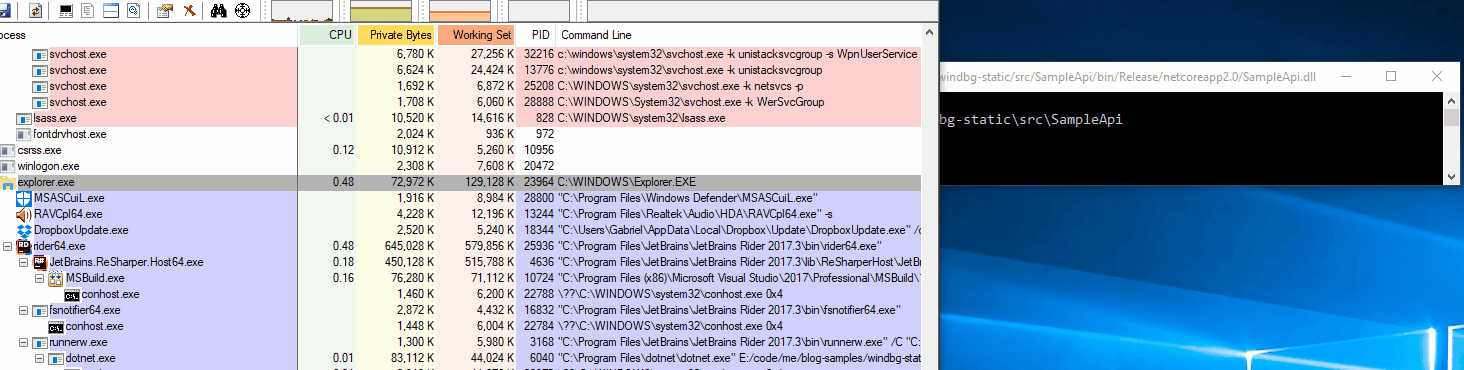
The Working Set is sitting just under 44 MB.
- Issue
20GETrequests tohttp://localhost:5000/feed/me
If you’re as lazy as me you can leverage Windows Subsystem for Linux:
for i in `seq 1 20`; do curl "http://localhost:5000/feed/me"; done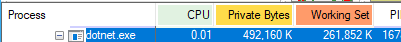
The Working Set is now sitting just under 262 MB. That’s an increase of roughly 10 MB per request.
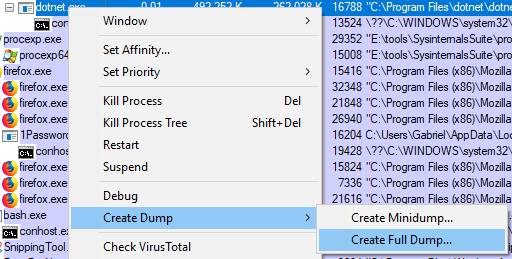
Capture a full memory dump
The easiest option in this case is to leverage Process Explorer as we already have it opened. Right-click on dotnet.exe and select Create Full Dump...:
Install and configure WinDbg
Follow these instructions:
- Download and install WinDbg
- Configure the symbols:
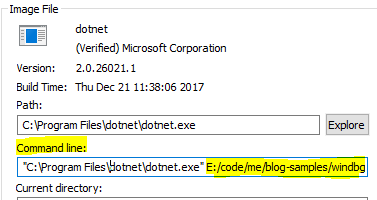
- Right-click on
dotnet.exeand selectProperties
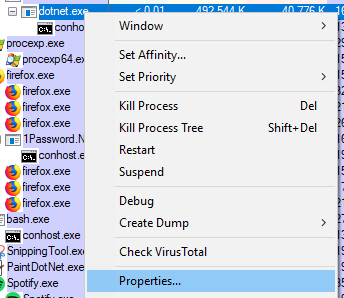
- Copy the path of the directory where
SampleApi.dllis located (in my case it isE:/code/me/blog-samples/windbg-static/src/SampleApi/bin/Release/netcoreapp2.0/)
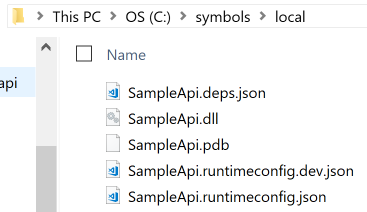
- Copy the content of this directory into your symbols directory (in my case I configured
sympathto includeC:\symbols\local\):
Now we’re in business!
Identifying the most problematic Type / instance
We’ll start with the DumpHeap command from the SOS extension.
Displays information about the garbage-collected heap […]. The
-statoption restricts the output to the statistical type summary.
Instead of listing every single object present in the heap(s), this will group them by Class Name and provide us with an instance Count and TotalSize taken (in bytes). Let’s run it:
0:000> !dumpheap -stat
Statistics:
              MT    Count    TotalSize Class Name
00007ffb0f6cec68        1           24 System.Collections.Generic.GenericEqualityComparer`1[[System.Int32, System.Private.CoreLib]]
00007ffb0f6cb200        1           24 System.Collections.Generic.GenericEqualityComparer`1[[System.Int64, System.Private.CoreLib]]
00007ffb0f6be130        1           24 System.Collections.Generic.GenericComparer`1[[System.Int32, System.Private.CoreLib]]
// Abbreviated
00007ffb0f632ca8       97       151456 System.Object[]
00007ffac6364330        8       262336 Microsoft.AspNetCore.Server.Kestrel.Transport.Libuv.Internal.LibuvThread+Work[]
00007ffac6158558    30346       971072 Microsoft.AspNetCore.Server.Kestrel.Core.Internal.Http.DateHeaderValueManager+DateHeaderValues
00007ffac638df58    30345      1942080 System.Collections.Concurrent.ConcurrentDictionary`2+<GetEnumerator>d__38[[System.Int64, System.Private.CoreLib],[Microsoft.AspNetCore.Server.Kestrel.Core.Internal.Infrastructure.FrameConnectionReference, Microsoft.AspNetCore.Server.Kestrel.Core]]
00007ffb0f633050    30475      2148742 System.Byte[]
00007ffb0f667be8    32554      2795084 System.String
00000190177eb6e0     2837     16874148      Free
00007ffb0f634158      158    251802384 System.Int32[]
Total 137415 objects
It looks like we have a winner! There are 158 instances of System.Int32[] for a TotalSize of 251802384 bytes. As we have only 158 instances it’s likely we have a few big instances, let’s list the ones that are bigger than 1000 bytes:
0:000> !dumpheap -type System.Int32[] -min 1000
         Address               MT     Size
0000019019413cf0 00007ffb0f634158     4120
0000019019414d08 00007ffb0f634158     8216
0000019019416d20 00007ffb0f634158    16408
000001901941ad38 00007ffb0f634158    32792
0000019019422d50 00007ffb0f634158    65560
000001941a364df0 00007ffb0f634158 33554456
000001941c364e28 00007ffb0f634158 134217752
0000019439341038 00007ffb0f634158 16777240
0000019449341038 00007ffb0f634158 67108888

Statistics:
              MT    Count    TotalSize Class Name
00007ffb0f634158        9    251785432 System.Int32[]
Total 9 objects
As it turns out one instance is 134217752 bytes which is roughly 134 MB. I suggest we start investigating this one.
Determine what is keeping our instance alive
We’ll use another SOS command: GCRoot.
Displays information about references (or roots) to an object at the specified address.
0:000> !gcroot 000001941c364e28
HandleTable:
    00000190176115f8 (pinned handle)
    -> 0000019419341038 System.Object[]
    -> 0000019019412bf0 System.Collections.Generic.List`1[[System.Int32, System.Private.CoreLib]]
    -> 000001941c364e28 System.Int32[]

Found 1 unique roots (run '!GCRoot -all' to see all roots).
This reads bottom to top, our Int32[] is referenced by a List<Int32>. This makes sense as List<T> is using an array internally:
The
List<T>classis the generic equivalent of theArrayListclass. It implements theIList<T>genericinterfaceby using an array whose size is dynamically increased as required.
In turn this List<Int32> is referenced by a System.Object[]. I was hoping to get the name of one of my class but I’ll have to dig deeper, let’s take a closer look at this array of object.
For this we’ll rely on the DumpObj command from the SOS extension.
0:000> !do 0000019419341038
Name:        System.Object[]
MethodTable: 00007ffb0f632ca8
EEClass:     00007ffb0edf2a00
Size:        8184(0x1ff8) bytes
Array:       Rank 1, Number of elements 1020, Type CLASS (Print Array)
Fields:
None
According to Sasha Goldshtein post this is how the CLR stores static fields:
This
objectarrayis ubiquitous, it would seem that allstaticroot references stem from it. Indeed (and this is aCLRimplementation detail),staticfields are stored in this array and their retention as far as theGCis concerned is through it.
Let’s now determine where in the array is our List referenced. We’ll use the Search Memory command which is the first WinDbg command we used today!
-q: we’re looking for aQWORD(the address is64 bit)L: this is a Range, we’re starting to search at the address0000019419341038(the beginning of the array) and we search the whole array (1ff8is the size of the array as indicated in the previous command output)0000019019412bf0is the address of theList
0:000> s -q 0000019419341038 L1ff8 0000019019412bf0
00000194`19342830  00000190`19412bf0 00000191`19397798
Sadly the lead stops there. We know this is a static field but we don’t know which class it belongs to.
Fishing with dynamite
There is one last thing we can try, we could look for references to 0000019419342830 in memory. This section is completely stolen from Sasha’s excellent post as I never did something like this before.
The SOS command DumpDomain comes in handy:
Enumerates each
Assemblyobject that is loaded within the specifiedAppDomainobject address.
0:000> !dumpdomain
--------------------------------------
System Domain:      00007ffb25d15800
LowFrequencyHeap:   00007ffb25d15d80
HighFrequencyHeap:  00007ffb25d15e10
StubHeap:           00007ffb25d15ea0
Stage:              OPEN
Name:               None
--------------------------------------
Shared Domain:      00007ffb25d15220
LowFrequencyHeap:   00007ffb25d15d80
HighFrequencyHeap:  00007ffb25d15e10
StubHeap:           00007ffb25d15ea0
Stage:              OPEN
Name:               None
Assembly:           0000019017796330 [C:\Program Files\dotnet\shared\Microsoft.NETCore.App\2.0.5\System.Private.CoreLib.dll]
ClassLoader:        00000190176b33f0
  Module Name
00007ffb0ed11000            C:\Program Files\dotnet\shared\Microsoft.NETCore.App\2.0.5\System.Private.CoreLib.dll

--------------------------------------
Domain 1:           00000190178511a0
LowFrequencyHeap:   00000190178519a0
HighFrequencyHeap:  0000019017851a30
StubHeap:           0000019017851ac0
Stage:              OPEN
SecurityDescriptor: 0000019017859320
Name:               clrhost
Assembly:           0000019017796330 [C:\Program Files\dotnet\shared\Microsoft.NETCore.App\2.0.5\System.Private.CoreLib.dll]
ClassLoader:        00000190176b33f0
SecurityDescriptor: 000001901774c9a0
  Module Name
00007ffb0ed11000            C:\Program Files\dotnet\shared\Microsoft.NETCore.App\2.0.5\System.Private.CoreLib.dll

Assembly:           0000019017796410 [E:\code\me\blog-samples\windbg-static\src\SampleApi\bin\Release\netcoreapp2.0\SampleApi.dll]
ClassLoader:        0000019017834490
SecurityDescriptor: 00000190177851c0
  Module Name
00007ffac5d04d38            E:\code\me\blog-samples\windbg-static\src\SampleApi\bin\Release\netcoreapp2.0\SampleApi.dll

Assembly:           0000019017786bb0 [C:\Program Files\dotnet\shared\Microsoft.NETCore.App\2.0.5\System.Runtime.dll]
ClassLoader:        0000019017834ee0
SecurityDescriptor: 0000019017784680
  Module Name
00007ffac5d05588            C:\Program Files\dotnet\shared\Microsoft.NETCore.App\2.0.5\System.Runtime.dll

// Abbreviated

Assembly:           0000019019319d90 [C:\Program Files\dotnet\store\x64\netcoreapp2.0\microsoft.aspnetcore.webutilities\2.0.1\lib\netstandard2.0\Microsoft.AspNetCore.WebUtilities.dll]
ClassLoader:        0000019463d80530
SecurityDescriptor: 0000019463dae9c0
  Module Name
00007ffac6549270            C:\Program Files\dotnet\store\x64\netcoreapp2.0\microsoft.aspnetcore.webutilities\2.0.1\lib\netstandard2.0\Microsoft.AspNetCore.WebUtilities.dll
SampleApi.dll is located at 00007ffac5d04d38 so it does make sense to start searching at 00007ffa00000000. Remember the Search Memory command we used above? We’ll put it to good use again:
L: this is a Range, we’re starting to search at the address00007ffa00000000- As we’re searching for a
QWORDthe unit is8 bytes(64 bit), so we’re looking ahead for40000000 * 8 = 320 MB
- As we’re searching for a
0:000> s -q 00007ffa00000000 L?00000000`40000000 0000019419342830
00007ffa`c5d05370  00000194`19342830 00000000`00000001
Bingo! Wow I didn’t think it would be that easy. We have a reference! Let’s use the WinDbg Unassemble command to look at the instructions:
0:000> !u 00007ffa`c5d05370
Unmanaged code
00007ffa`c5d05370 3028            xor     byte ptr [rax],ch
00007ffa`c5d05372 3419            xor     al,19h
00007ffa`c5d05374 94              xchg    eax,esp
00007ffa`c5d05375 0100            add     dword ptr [rax],eax
00007ffa`c5d05377 0001            add     byte ptr [rcx],al
00007ffa`c5d05379 0000            add     byte ptr [rax],al
00007ffa`c5d0537b 0000            add     byte ptr [rax],al
00007ffa`c5d0537d 0000            add     byte ptr [rax],al
00007ffa`c5d0537f 0000            add     byte ptr [rax],al
00007ffa`c5d05381 0000            add     byte ptr [rax],al
Looks like I might have celebrated prematurely. Let’s extend the range:
0:000> s -q 00007ffa00000000 L?00000000`80000000 0000019419342830
00007ffa`c5d05370  00000194`19342830 00000000`00000001
Same result!
Again, this is where Sasha comes to the rescue:
The problem is that we might miss unaligned references to that address, which may occur if it is hardcoded into some instruction (e.g. a
MOV). So instead we should be looking for the individual byte sequence, and remember that we are on a little-endian architecture
The command is the same than the previous one except for two differences:
- This time we’re searching for bytes
-b - As we’re on a little-endian architecture,
0000019419342830turn into30 28 34 19 94 01 00 00
0:000> s -b 00007ffa00000000 L?00000000`320000000 30 28 34 19 94 01 00 00
00007ffa`c5d05370  30 28 34 19 94 01 00 00-01 00 00 00 00 00 00 00  0(4.............
00007ffa`c63902ac  30 28 34 19 94 01 00 00-48 8b 31 b9 01 00 00 00  0(4.....H.1.....
00007ffa`c6501b6e  30 28 34 19 94 01 00 00-48 8b 55 f8 e8 81 0b 44  0(4.....H.U....D
I’ve already unassembled the first address, let’s look at the two other ones:
0:000> !u 00007ffa`c63902ac
Normal JIT generated code
DynamicClass.lambda_method(System.Runtime.CompilerServices.Closure, System.Object, System.Object[])
Begin 00007ffac6390270, size 71
LoadSymbols moduleData.Request FAILED 0x80004005
00007ffa`c6390270 56              push    rsi
LoadSymbols moduleData.Request FAILED 0x80004005
00007ffa`c6390271 4883ec20        sub     rsp,20h
LoadSymbols moduleData.Request FAILED 0x80004005
00007ffa`c6390275 488bf2          mov     rsi,rdx
LoadSymbols moduleData.Request FAILED 0x80004005
00007ffa`c6390278 4885f6          test    rsi,rsi
LoadSymbols moduleData.Request FAILED 0x80004005
00007ffa`c639027b 7417            je      00007ffa`c6390294
LoadSymbols moduleData.Request FAILED 0x80004005
00007ffa`c639027d 48b910d53cc6fa7f0000 mov rcx,7FFAC63CD510h (MT: SampleApi.Controllers.FeedController)
LoadSymbols moduleData.Request FAILED 0x80004005
00007ffa`c6390287 48390e          cmp     qword ptr [rsi],rcx
LoadSymbols moduleData.Request FAILED 0x80004005
00007ffa`c639028a 7408            je      00007ffa`c6390294
LoadSymbols moduleData.Request FAILED 0x80004005
00007ffa`c639028c e88f225b5f      call    coreclr!JIT_ChkCastClassSpecial (00007ffb`25942520)
LoadSymbols moduleData.Request FAILED 0x80004005
00007ffa`c6390291 488bf0          mov     rsi,rax
LoadSymbols moduleData.Request FAILED 0x80004005
00007ffa`c6390294 8b0e            mov     ecx,dword ptr [rsi]
LoadSymbols moduleData.Request FAILED 0x80004005
00007ffa`c6390296 48b95053d0c5fa7f0000 mov rcx,7FFAC5D05350h
LoadSymbols moduleData.Request FAILED 0x80004005
00007ffa`c63902a0 ba03000000      mov     edx,3
LoadSymbols moduleData.Request FAILED 0x80004005
00007ffa`c63902a5 e8a6515b5f      call    coreclr!JIT_GetSharedNonGCStaticBase_SingleAppDomain (00007ffb`25945450)
LoadSymbols moduleData.Request FAILED 0x80004005
00007ffa`c63902aa 48b93028341994010000 mov rcx,19419342830h
LoadSymbols moduleData.Request FAILED 0x80004005
00007ffa`c63902b4 488b31          mov     rsi,qword ptr [rcx]
LoadSymbols moduleData.Request FAILED 0x80004005
00007ffa`c63902b7 b901000000      mov     ecx,1
LoadSymbols moduleData.Request FAILED 0x80004005
00007ffa`c63902bc ba40420f00      mov     edx,0F4240h
LoadSymbols moduleData.Request FAILED 0x80004005
00007ffa`c63902c1 e8a213adff      call    00007ffa`c5e61668 (System.Linq.Enumerable.Range(Int32, Int32), mdToken: 0000000006000090)
LoadSymbols moduleData.Request FAILED 0x80004005
00007ffa`c63902c6 4c8bc0          mov     r8,rax
LoadSymbols moduleData.Request FAILED 0x80004005
00007ffa`c63902c9 8b5618          mov     edx,dword ptr [rsi+18h]
LoadSymbols moduleData.Request FAILED 0x80004005
00007ffa`c63902cc 488bce          mov     rcx,rsi
LoadSymbols moduleData.Request FAILED 0x80004005
00007ffa`c63902cf 48b8c0d6330ffb7f0000 mov rax,offset System_Private_CoreLib+0x62d6c0 (00007ffb`0f33d6c0)
LoadSymbols moduleData.Request FAILED 0x80004005
00007ffa`c63902d9 4883c420        add     rsp,20h
LoadSymbols moduleData.Request FAILED 0x80004005
00007ffa`c63902dd 5e              pop     rsi
LoadSymbols moduleData.Request FAILED 0x80004005
00007ffa`c63902de 48ffe0          jmp     rax
That’s much nicer, there is a reference to one of my class: SampleApi.Controllers.FeedController. What about the other address:
0:000> !u 00007ffa`c6501b6e
Normal JIT generated code
SampleApi.Controllers.FeedController..cctor()
Begin 00007ffac6501b40, size 46

E:\code\me\blog-samples\windbg-static\src\SampleApi\Controllers\FeedController.cs @ 10:
00007ffa`c6501b40 55              push    rbp
00007ffa`c6501b41 4883ec30        sub     rsp,30h
00007ffa`c6501b45 488d6c2430      lea     rbp,[rsp+30h]
00007ffa`c6501b4a 33c0            xor     eax,eax
00007ffa`c6501b4c 488945f8        mov     qword ptr [rbp-8],rax
00007ffa`c6501b50 48b9885d670ffb7f0000 mov rcx,offset System_Private_CoreLib+0x965d88 (00007ffb`0f675d88) (MT: System.Collections.Generic.List`1[[System.Int32, System.Private.CoreLib]])
00007ffa`c6501b5a e89127445f      call    coreclr!JIT_TrialAllocSFastMP_InlineGetThread (00007ffb`259442f0)
00007ffa`c6501b5f 488945f8        mov     qword ptr [rbp-8],rax
00007ffa`c6501b63 488b4df8        mov     rcx,qword ptr [rbp-8]
00007ffa`c6501b67 e874cde348      call    System_Private_CoreLib+0x62e8e0 (00007ffb`0f33e8e0) (System.Collections.Generic.List`1[[System.Int32, System.Private.CoreLib]]..ctor(), mdToken: 00000000060038ae)
00007ffa`c6501b6c 48b93028341994010000 mov rcx,19419342830h
00007ffa`c6501b76 488b55f8        mov     rdx,qword ptr [rbp-8]
00007ffa`c6501b7a e8810b445f      call    coreclr!JIT_CheckedWriteBarrier (00007ffb`25942700)
00007ffa`c6501b7f 90              nop
00007ffa`c6501b80 488d6500        lea     rsp,[rbp]
00007ffa`c6501b84 5d              pop     rbp
00007ffa`c6501b85 c3              ret
This goes a step farther as it references the static constructor of FeedController (SampleApi.Controllers.FeedController..cctor()). We now have enough information to inspect the code but first let’s take a deeper look at the FeedController class.
Let’s use the SOS Name2EE command.
Displays the
MethodTablestructure andEEClassstructure for the specified type or method in the specified module. […] This command supports the Windows debugger syntax of<module>!<type>. The type must be fully qualified.
0:000> !name2ee SampleApi!SampleApi.Controllers.FeedController
Module:      00007ffac5d04d38
Assembly:    SampleApi.dll
Token:       0000000002000004
MethodTable: 00007ffac63cd510
EEClass:     00007ffac63bf968
Name:        SampleApi.Controllers.FeedController
We’ll use the SOS DumpClass command.
Displays information about the
EEClassstructure associated with a type.
0:000> !DumpClass /d 00007ffac63bf968
Class Name:      SampleApi.Controllers.FeedController
mdToken:         0000000002000004
File:            E:\code\me\blog-samples\windbg-static\src\SampleApi\bin\Release\netcoreapp2.0\SampleApi.dll
Parent Class:    00007ffac63bf868
Module:          00007ffac5d04d38
Method Table:    00007ffac63cd510
Vtable Slots:    90
Total Method Slots:  92
Class Attributes:    100001
Transparency:        Critical
NumInstanceFields:   8
NumStaticFields:     1
              MT    Field   Offset                 Type VT     Attr            Value Name
00007ffac62ec808  400004a        8 ...ControllerContext  0 instance           _controllerContext
00007ffac6061d88  400004b       10 ...lMetadataProvider  0 instance           _metadataProvider
00007ffac6062f20  400004c       18 ...odelBinderFactory  0 instance           _modelBinderFactory
00007ffac6063178  400004d       20 ...ectModelValidator  0 instance           _objectValidator
00007ffac6487758  400004e       28 ...re.Mvc.IUrlHelper  0 instance           _url
00007ffac6487630  4000018       30 ...empDataDictionary  0 instance           _tempData
0000000000000000  4000019       38 ...l.DynamicViewData  0 instance           _viewBag
00007ffac6487480  400001a       40 ...iewDataDictionary  0 instance           _viewData
00007ffb0f675d88  4000002        8 ...Private.CoreLib]]  0   static 0000019019412bf0 MemoryHog
So, it turns out the FeedController has a static field named MemoryHog. Probably not my finest piece of coding to be honest.
Conclusion
I learned how to trace back a static field to a class. I’m sure this will come in handy later.
I might have made some mistakes around Ranges as this is an area I’m still unfamiliar with but it shouldn’t prevent you from achieving the same result.
Until next time!