Today’s exercise is not an exercise! The investigation I’m about to describe was triggered by a production outage affecting multiple APIs - albeit not at the same time - at a customer. For obvious reasons I’ll not be able to share the code and will have to alter / obfuscate some of the commands’ results. I still think this is a valuable exercise as it is a classic example of an easy to make mistake leading to a catastrophic result.
The other interesting point is that I had no idea what the issue was so I’ll not be following a script as I did in the first instalment.
The symptoms
A week prior we had another production outage. One of our API became unresponsive, requests would sit in Chrome waiting for minutes for the server to reply. Logs did not yield anything interesting and according to New Relic we had a quasiperfect Apdex.
- The working theory was that requests were failing early in the pipeline so that our logging did not pick anything
- According to
New Relicour traffic plummeted during the outage. So basically,New Relicwas not capturing any of the failing requests and the dashboards were all green!
At this stage I recommended to capture a memory dump before restarting the web app. The later happened but the former did not. The app recycled and started to serve production traffic again but we were left with few clues. Afterwards the operation team engaged Microsoft and learned than the thread count spiked during the outage.
I then wrote a guide explaining how to write a memory dump and we instructed the operation team to capture a memory dump before recycling the app if the outage were to happen again.
We were left with two clues:
- Unresponsive web app
- High thread count
We had released a new version of this API a week before the outage. The release included a fix that I did for an intermittent 500 error that our testers and front-end teams experienced. The patch involved modifying the lifetime of some classes involved in the logging system. The Pull Request had been approved after a heated discussion and as soon as news of the outage broke, fingers were pointed at my fix.
Draw of luck
Come Friday morning, I’m sipping my Dirty Chai while absently looking at Slack. Suddenly a message catches my attention:
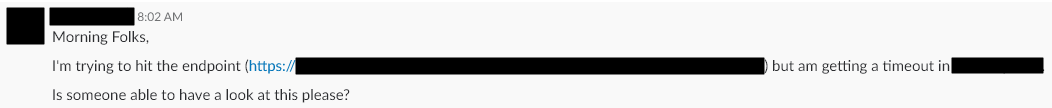
This is the same API that went down last week! My heart beats slightly faster while I fire up the Azure portal. And sure enough the thread count is far too high for the current dev traffic this API is serving:
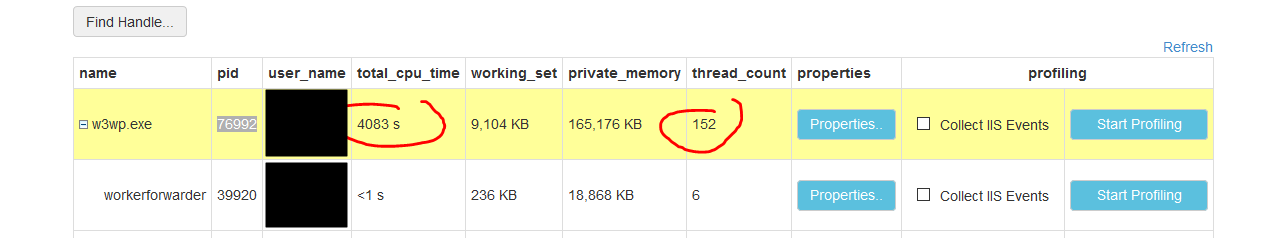
I write a memory dump, slurp the end of my Dirty Chai and go to work thinking I’ll allocate some WinDbg time during the week-end.
We’re down again
A few hours later another API experiences a significant outage. The symptoms are eerily similar. I was waiting for another of my PR to get approved but the process is being delayed as our build server is down. I don’t have access to the memory dump that was written in production during the outage but it’s likely the outages have a common cause; hence I decide to take my frustration out on the memory dump I wrote in the morning.
Investigation
Threads all the things
The first question I had was: why do we have so many threads and what are they doing?
I’ll start with the Threads SOS command.
Displays all managed threads in the process.
Note: The first column is the thread ID.
0:000> !threads
ThreadCount:      145
UnstartedThread:  0
BackgroundThread: 133
PendingThread:    0
DeadThread:       12
Hosted Runtime:   no
                                                                         Lock
       ID OSID ThreadOBJ    State GC Mode     GC Alloc Context  Domain   Count Apt Exception
   4    1 4420 05db3d78     28220 Preemptive  00000000:00000000 04e8e548 0     Ukn
  22    2 c3ac 05dc9200     2b220 Preemptive  00000000:00000000 04e8e548 0     MTA (Finalizer)
  23    3 108fc 05e0f738   102a220 Preemptive  00000000:00000000 04e8e548 0     MTA (Threadpool Worker)
  25    4 10ddc 05e1c0f0     21220 Preemptive  00000000:00000000 04e8e548 0     Ukn
  26    7 9010 05eb8e90   1020220 Preemptive  00000000:00000000 04e8e548 0     Ukn (Threadpool Worker)
#
# Abbreviated
#
 144  127 ed88 23f294b0   1029220 Preemptive  0E65ACE0:00000000 04e8e548 0     MTA (Threadpool Worker)
 145  141 ba3c 2407e100   3029220 Preemptive  0E61BF28:00000000 20e69ac0 0     MTA (Threadpool Worker)
 146  140 9cfc 23f20428   1029220 Preemptive  0A524AFC:00000000 04e8e548 0     MTA (Threadpool Worker)
 147  131 194f8 20f753a8   3029220 Preemptive  00000000:00000000 20e69ac0 0     MTA (Threadpool Worker)
 148  144 f4a8 23f20970   1029220 Preemptive  064DFA28:00000000 04e8e548 0     MTA (Threadpool Worker)
 149  145 9028 20f758f0     20220 Preemptive  06443CB8:00000000 04e8e548 0     Ukn
 150  143 16520 23f299f8   1029220 Preemptive  1253C4A8:00000000 04e8e548 0     MTA (Threadpool Worker)
 151  146 13db0 23f20eb8     20220 Preemptive  0E61FB98:00000000 04e8e548 0     Ukn
I then pick a few threads to see what they’re doing. To achieve this I’ll combine two different commands:
- Thread-Specific Command: The
~ecommand executes one or more commands for a specific thread
~<thread-ID>e <command>- CLRStack: Provides a stack trace of managed code only
Thread 143
0:000> ~143e !CLRStack
OS Thread Id: 0xb9ac (143)
Child SP       IP Call Site
2a8bd110 7712eb2c [GCFrame: 2a8bd110]
2a8bd2b8 7712eb2c [GCFrame: 2a8bd2b8]
2a8bd268 7712eb2c [HelperMethodFrame: 2a8bd268] System.Threading.Monitor.ReliableEnter(System.Object, Boolean ByRef)
2a8bd2f8 21ab107d Autofac.Core.Lifetime.LifetimeScope.GetOrCreateAndShare(System.Guid, System.Func`1)
2a8bd344 21ab0f15 Autofac.Core.Resolving.InstanceLookup.Execute()
2a8bd370 21ab0a16 Autofac.Core.Resolving.ResolveOperation.GetOrCreateInstance(Autofac.Core.ISharingLifetimeScope, Autofac.Core.IComponentRegistration, System.Collections.Generic.IEnumerable`1)
2a8bd390 21ab20e1 Autofac.Core.Resolving.InstanceLookup.ResolveComponent(Autofac.Core.IComponentRegistration, System.Collections.Generic.IEnumerable`1)
# Abbreviated
So thread 143 is trying to acquire a lock: System.Threading.Monitor.ReliableEnter(System.Object, Boolean ByRef). Let’s look at another thread.
Thread 136
0:000> ~136e !CLRStack
OS Thread Id: 0x17e4 (136)
Child SP       IP Call Site
2b07d610 7712eb2c [GCFrame: 2b07d610]
2b07d7bc 7712eb2c [GCFrame: 2b07d7bc]
2b07d76c 7712eb2c [HelperMethodFrame: 2b07d76c] System.Threading.Monitor.ReliableEnter(System.Object, Boolean ByRef)
2b07d7fc 21ab107d Autofac.Core.Lifetime.LifetimeScope.GetOrCreateAndShare(System.Guid, System.Func`1)
2b07d848 21ab0f15 Autofac.Core.Resolving.InstanceLookup.Execute()
2b07d874 21ab0a16 Autofac.Core.Resolving.ResolveOperation.GetOrCreateInstance(Autofac.Core.ISharingLifetimeScope, Autofac.Core.IComponentRegistration, System.Collections.Generic.IEnumerable`1)
2b07d894 21ab20e1 Autofac.Core.Resolving.InstanceLookup.ResolveComponent(Autofac.Core.IComponentRegistration, System.Collections.Generic.IEnumerable`1)
# Abbreviated
Thread 136 is also trying to acquire a lock.
Thread 123
0:000> ~123e !CLRStack
OS Thread Id: 0x4ce4 (123)
Child SP       IP Call Site
3d14d850 7712eb2c [GCFrame: 3d14d850]
3d14d9fc 7712eb2c [GCFrame: 3d14d9fc]
3d14d9ac 7712eb2c [HelperMethodFrame: 3d14d9ac] System.Threading.Monitor.ReliableEnter(System.Object, Boolean ByRef)
3d14da3c 21ab107d Autofac.Core.Lifetime.LifetimeScope.GetOrCreateAndShare(System.Guid, System.Func`1)
3d14da88 21ab0f15 Autofac.Core.Resolving.InstanceLookup.Execute()
3d14dab4 21ab0a16 Autofac.Core.Resolving.ResolveOperation.GetOrCreateInstance(Autofac.Core.ISharingLifetimeScope, Autofac.Core.IComponentRegistration, System.Collections.Generic.IEnumerable`1)
3d14dad4 21ab20e1 Autofac.Core.Resolving.InstanceLookup.ResolveComponent(Autofac.Core.IComponentRegistration, System.Collections.Generic.IEnumerable`1)
# Abbreviated
Thread 123 is also trying to acquire a lock. By now it’s safe to assume than many threads are trying to acquire a lock. How many of them exactly? And more importantly: which naughty thread is holding on the lock?
Who is holding on the lock?
Time to use another SOS command: SyncBlk.
0:000> !syncblk
Index         SyncBlock MonitorHeld Recursion Owning Thread Info          SyncBlock Owner
   52 20ee3118          229         2 20fc6ba0 9628  42   0a13ee8c System.Object
-----------------------------
Total           279
CCW             4
RCW             3
ComClassFactory 0
Free            206
Thread ID 42 is holding the lock. The third column (MonitorHeld) indicates how many threads are trying to acquire the same lock. In this case it is 114 ((229 - 1) / 2). You can read more about how I computed this number in this Stack Overflow answer.
What is thread 42 doing?
0:000> ~42e !CLRStack
OS Thread Id: 0x9628 (42)
Child SP       IP Call Site
293bd178 7712eb2c [GCFrame: 293bd178]
293bd228 7712eb2c [HelperMethodFrame_1OBJ: 293bd228] System.Threading.Monitor.ObjWait(Boolean, Int32, System.Object)
293bd2b4 707bc273 System.Threading.Monitor.Wait(System.Object, Int32, Boolean) [f:\dd\ndp\clr\src\BCL\system\threading\monitor.cs @ 203]
293bd2c4 7084ca14 System.Threading.Monitor.Wait(System.Object, Int32) [f:\dd\ndp\clr\src\BCL\system\threading\monitor.cs @ 213]
293bd2c8 707ccb56 System.Threading.ManualResetEventSlim.Wait(Int32, System.Threading.CancellationToken)
293bd31c 707c785c System.Threading.Tasks.Task.SpinThenBlockingWait(Int32, System.Threading.CancellationToken) [f:\dd\ndp\clr\src\BCL\system\threading\Tasks\Task.cs @ 3320]
293bd35c 70868aed System.Threading.Tasks.Task.InternalWait(Int32, System.Threading.CancellationToken) [f:\dd\ndp\clr\src\BCL\system\threading\Tasks\Task.cs @ 3259]
293bd3c0 707c58ca System.Runtime.CompilerServices.TaskAwaiter.HandleNonSuccessAndDebuggerNotification(System.Threading.Tasks.Task) [f:\dd\ndp\clr\src\BCL\system\runtime\compilerservices\TaskAwaiter.cs @ 148]
293bd3cc 1f4e5fd3 Contoso.AzureKeyVaultClient.GetSecretByName(System.String)
293bd3d8 1f4e5d80 Contoso.SecureAppSettings.GetOrFail(System.String)
293bd3f0 1f4e5ccb Contoso.CachableSecureAppSettings.GetOrFail(System.String)
293bd404 218b4f94 Contoso.SomeSecureSettings..ctor(Contoso.ISecureSettings)
293bd418 20af91eb DynamicClass.lambda_method(System.Runtime.CompilerServices.Closure, System.Object[])
293bd424 21ab1ef5 Autofac.Core.Activators.Reflection.ConstructorParameterBinding.Instantiate()
The last line executed in our code was:
Contoso.AzureKeyVaultClient.GetSecretByName(System.String)Despite its name it seems to be executing async code and even more troubling it looks like we’re blocking. I have enough information to locate the source and find the following method:
public string GetSecretByName(string secretName)
{
    return GetSecretByNameAsync(secretName).GetAwaiter().GetResult();
}
Sure enough we’re blocking on an async method. I’ll let Stephen Cleary explains what’s wrong but it can be summed up as: Don’t Block on Async Code (seriously read the blog post).
Solution
There are two alternatives:
-
Resolve the secret on application startup. At this stage we’re single threaded and there is no request context so we can block without risking a deadlock. It isn’t pretty and will slow down the application startup but it works.
-
A nicer option would be to resolve the secret when needed (lazy initialization). By then we’ll be in an
asyncmethod and we will be able to call theAsyncoverload.
Conclusion
Once again WinDbg has delivered the goods. I write up my findings and communicate them to my colleagues. It’s 4:30 PM and the build server is still not fixed, I decide to call it a day.